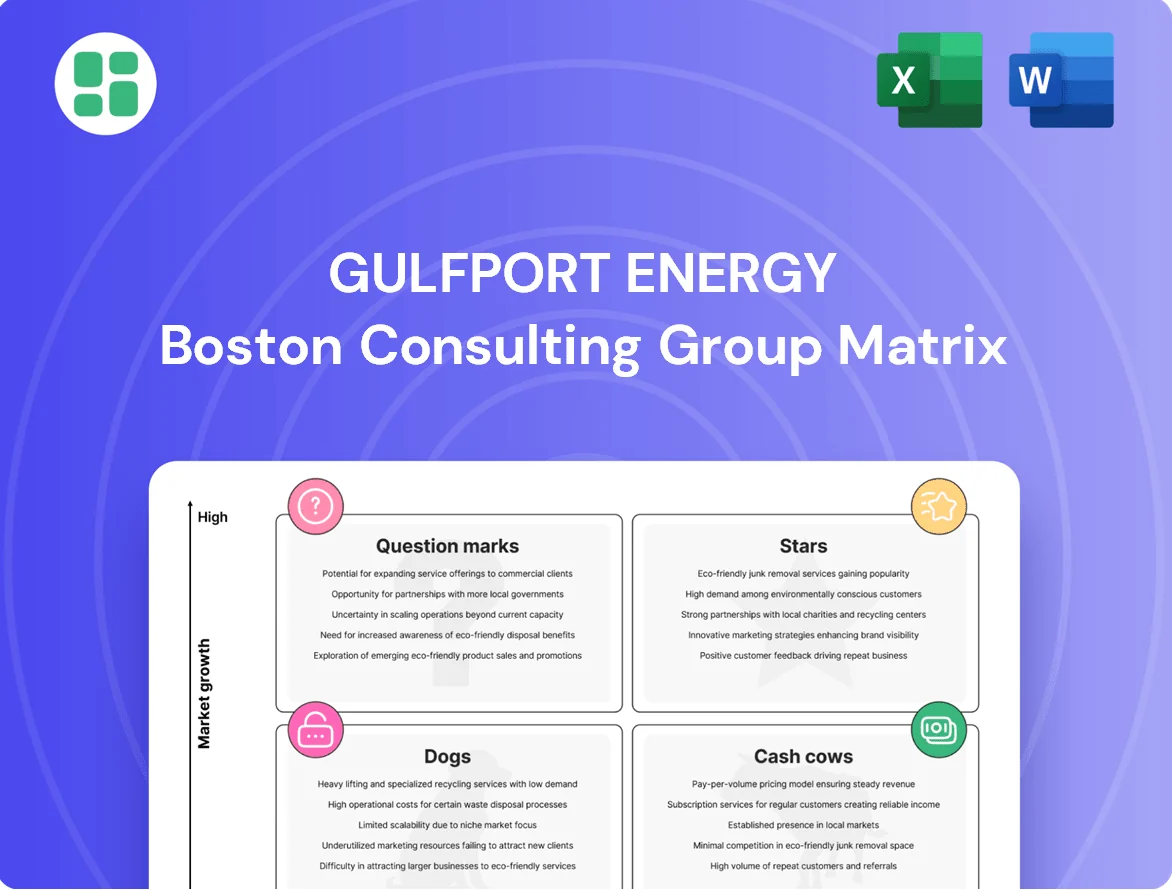
Gulfport Energy Boston Consulting Group Matrix

Unlock Strategic Clarity
Curious about Gulfport Energy's strategic positioning? Our BCG Matrix preview hints at which segments are driving growth and which might need a closer look. Don't miss out on the full picture—unlock the complete BCG Matrix to understand their Stars, Cash Cows, Dogs, and Question Marks, and gain actionable insights for your own strategic planning.
Stars

Utica Dry Gas Development
Gulfport Energy is making a significant strategic move towards dry gas development in the Utica region. This focus is projected to drive a substantial 20% increase in their natural gas production by the end of 2025, when compared to the first quarter of that year.
This strategic pivot is well-timed, aligning with a positive outlook for the natural gas market in 2026. The company anticipates benefiting from rising commodity prices, making this a key growth area.
Operational enhancements in Ohio are fueling this expansion, evidenced by a notable 28% improvement in average daily drilling footage throughout 2024. This efficiency boost solidifies the Utica dry gas play as a high-growth, high-market-share segment for Gulfport Energy.
Liquids Production Growth
Gulfport Energy is projecting a significant increase in its net daily liquids production, aiming for a 30% jump by 2025 over 2024 levels, with a target of 18.0 to 20.5 MBbl per day.
This expansion is largely fueled by advanced flowback techniques in the SCOOP basin, a strategy designed to bolster profit margins and improve free cash flow. The company's second quarter 2025 performance already demonstrated this momentum, with a 26% sequential rise in liquids production, underscoring successful operational execution in this key growth area.

Operational Efficiency Leadership
Gulfport Energy demonstrates exceptional leadership in operational efficiency, particularly evident in its Ohio drilling ventures. This focus has driven significant cost savings, with drilling and completion costs per lateral foot decreasing by approximately 35% from 2022 levels, projected to reach around $900 per foot for 2025.
This robust operational performance and strict cost management create a distinct competitive edge. It allows Gulfport to sustain a strong market position and profitability, even when oil and gas prices fluctuate unpredictably.

High-Quality Inventory Expansion
Gulfport Energy is strategically investing in expanding its high-quality inventory, particularly in the Utica Shale. The company has earmarked between $75 million and $100 million for discretionary acreage acquisitions in 2025. This focused investment aims to bolster its inventory of low-breakeven wells.
This expansion is projected to add more than two years to Gulfport's existing inventory runway. Such a move is critical for sustaining its long-term production capabilities and reinforcing its leadership in key unconventional resource plays. By prioritizing organic growth of its inventory, Gulfport is positioning itself for sustained high market share in these developing plays.
- Targeted Acquisitions: $75 million to $100 million allocated for 2025 discretionary acreage acquisitions.
- Strategic Focus: Expansion of high-quality, low-breakeven inventory in the Utica Shale.
- Inventory Runway Extension: Expected to add over two years to the company's inventory life.
- Market Position: Aims to solidify long-term production and leadership in key unconventional plays.
Strategic Capital Allocation for Growth
Gulfport Energy strategically directs capital towards enhancing its development program and portfolio, aiming for greater capital efficiency and robust corporate margins.
The company prioritizes investment in its core Utica and SCOOP assets. This focus, combined with its strong adjusted free cash flow generation, solidifies these regions as key areas for sustained capital allocation to preserve and expand their market leadership.
- Strategic Capital Allocation: Gulfport's strategy centers on optimizing its development program and asset portfolio to boost capital efficiencies and corporate margins.
- Core Asset Focus: The company is heavily investing in its foundational Utica and SCOOP assets.
- Cash Flow Generation: Gulfport's ability to generate substantial adjusted free cash flow supports its ongoing investment in these key operational areas.
- Market Position: Continued investment aims to maintain and grow the leading market positions of its Utica and SCOOP assets.
Gulfport Energy's Utica Dry Gas: A Shining Star
Gulfport Energy's strategic emphasis on dry gas in the Utica region, coupled with operational efficiencies, positions this segment as a Star in its BCG Matrix. The projected 20% increase in natural gas production by the end of 2025, compared to Q1 2025, and a 28% improvement in average daily drilling footage in 2024 highlight its high growth potential.
The company's aggressive expansion into dry gas development, expected to benefit from rising natural gas prices in 2026, further solidifies its Star status. This focus on a high-growth market, supported by strong operational execution and cost management, indicates a dominant market share in this segment.
| Segment | Growth Rate | Market Share | BCG Category |
|---|---|---|---|
| Utica Dry Gas | High (Projected 20% production increase by end of 2025) | High (Strong operational efficiencies and market focus) | Star |
| SCOOP Liquids | High (Projected 30% liquids production increase by 2025) | Moderate to High (Driven by advanced flowback techniques) | Question Mark / Star |
What is included in the product
 Detailed Word Document
This BCG Matrix overview for Gulfport Energy analyzes its business units based on market share and growth.
It provides strategic guidance on which segments to invest in, maintain, or divest.

 Customizable Excel Spreadsheet
A clear BCG Matrix visualizes Gulfport Energy's portfolio, alleviating the pain of complex strategic decision-making.
Cash Cows

Utica and Marcellus Natural Gas Production
Gulfport Energy's Utica and Marcellus natural gas production in Eastern Ohio are its undisputed cash cows. These regions are the backbone of the company's operations, contributing around 80% of its total output in 2024, primarily in the form of natural gas.
Despite potential fluctuations in the broader natural gas market, Gulfport's well-established presence in these mature basins ensures a steady and significant generation of cash flow. This consistent performance underscores their role as reliable profit drivers for the company.
SCOOP Natural Gas and Liquids Production (Mature)
Gulfport Energy's SCOOP Natural Gas and Liquids Production (Mature) segment, primarily in Oklahoma's Woodford and Springer plays, functions as a classic cash cow. These operations are the bedrock of its revenue, consistently generating reliable income.
While not as expansive as its Utica operations, the SCOOP assets are mature, meaning they leverage established infrastructure for cost-effective production. This efficiency translates into strong, consistent cash flow for Gulfport.
In 2024, Gulfport reported that its SCOOP assets continued to provide a significant and stable contribution to its overall production volumes, underpinning its financial stability. The focus here is on maximizing returns from existing, low-cost wells rather than aggressive expansion.

Consistent Free Cash Flow Generation
Gulfport Energy's core assets are performing exceptionally well, consistently producing substantial free cash flow. The company anticipates generating between $2.8 billion and $3.6 billion in adjusted free cash flow from 2025 through 2029, depending on commodity prices. This strong cash generation is a hallmark of mature, profitable operations.
Historically, Gulfport has returned a significant portion of this cash flow to shareholders, with 96-99% directed towards share repurchases. These established production streams are the engine driving shareholder returns and supporting broader corporate objectives.

Low Leverage and Strong Liquidity
Gulfport Energy demonstrates a robust financial footing, characterized by a prudent leverage ratio of roughly 0.85x. This conservative approach to debt management is further supported by significant liquidity, which stood at approximately $885 million as of the second quarter of 2025. This financial health is a direct result of its cash-generating assets, allowing for effective debt servicing and strategic capital deployment without undue reliance on external funding for day-to-day activities.
This financial stability is a hallmark of successful cash cow operations.
- Conservative Leverage: Gulfport Energy maintains a low debt-to-equity ratio, around 0.85x, indicating a strong capacity to meet its financial obligations.
- Substantial Liquidity: With approximately $885 million in liquidity as of Q2 2025, the company possesses ample resources to manage operations and pursue opportunities.
- Financial Flexibility: The combination of low leverage and high liquidity provides Gulfport with considerable freedom in allocating capital and weathering market fluctuations.
Optimized Per-Unit Operating Costs
Gulfport Energy's optimized per-unit operating costs are a key driver of its cash cow status. In the second quarter of 2025, the company reported per-unit operating costs of $1.22 per Mcfe. This figure reflects a sustained effort in cost discipline, showing improvements from previous periods.
These highly efficient operating costs, particularly within its core production regions, translate directly into robust profit margins for its mature assets. This efficiency solidifies these assets’ position as reliable cash generators for the company.
- Disciplined Operating Costs: Per-unit operating costs at $1.22 per Mcfe in Q2 2025.
- High Profit Margins: Low costs ensure strong profitability from mature assets.
- Cash Flow Maximization: Operational efficiency directly boosts cash flow from existing production.
Gulfport's Cash Cows: Utica, Marcellus, and SCOOP Fueling Growth
Gulfport Energy's Utica and Marcellus natural gas production in Eastern Ohio, along with its SCOOP Natural Gas and Liquids Production in Oklahoma, are firmly established as its cash cows. These regions consistently generate substantial free cash flow, a testament to their mature and efficient operations. The company anticipates generating between $2.8 billion and $3.6 billion in adjusted free cash flow from 2025 through 2029, with a significant portion attributed to these core assets.
These cash cows are characterized by disciplined operating costs, with per-unit costs at $1.22 per Mcfe in Q2 2025, ensuring strong profit margins. This operational efficiency directly translates into robust cash generation, allowing Gulfport to maintain a conservative leverage ratio of approximately 0.85x and substantial liquidity of $885 million as of Q2 2025.
The company prioritizes returning this generated cash to shareholders, with 96-99% historically directed towards share repurchases, underscoring the reliable profitability of these mature production areas.
| Asset Segment | Primary Region | 2024 Production Contribution (Approx.) | Key Characteristic |
|---|---|---|---|
| Utica & Marcellus | Eastern Ohio | ~80% of Total Output | Mature, High-Volume Natural Gas Production |
| SCOOP Natural Gas and Liquids | Oklahoma (Woodford & Springer) | Significant & Stable Contribution | Mature, Cost-Effective Production |
| Financial Metric | |||
| Adjusted Free Cash Flow (2025-2029 Est.) | $2.8B - $3.6B | Driven by Cash Cow Assets | |
| Leverage Ratio (Approx.) | 0.85x | Conservative Debt Management | |
| Liquidity (Q2 2025) | $885 Million | Strong Financial Flexibility |
Preview = Final Product
Gulfport Energy BCG Matrix
The Gulfport Energy BCG Matrix preview you are viewing is the exact, fully formatted document you will receive immediately after purchase. This means no watermarks, no demo content, and no surprises—just a professionally designed, analysis-ready report ready for your strategic planning and decision-making.

Product Information
Product Information
Shipping & Returns
Shipping & Returns
Gulfport Energy Boston Consulting Group Matrix
Gulfport Energy Boston Consulting Group Matrix
Unlock Strategic Clarity
Curious about Gulfport Energy's strategic positioning? Our BCG Matrix preview hints at which segments are driving growth and which might need a closer look. Don't miss out on the full picture—unlock the complete BCG Matrix to understand their Stars, Cash Cows, Dogs, and Question Marks, and gain actionable insights for your own strategic planning.
Stars
Utica Dry Gas Development
Gulfport Energy is making a significant strategic move towards dry gas development in the Utica region. This focus is projected to drive a substantial 20% increase in their natural gas production by the end of 2025, when compared to the first quarter of that year.
This strategic pivot is well-timed, aligning with a positive outlook for the natural gas market in 2026. The company anticipates benefiting from rising commodity prices, making this a key growth area.
Operational enhancements in Ohio are fueling this expansion, evidenced by a notable 28% improvement in average daily drilling footage throughout 2024. This efficiency boost solidifies the Utica dry gas play as a high-growth, high-market-share segment for Gulfport Energy.
Liquids Production Growth
Gulfport Energy is projecting a significant increase in its net daily liquids production, aiming for a 30% jump by 2025 over 2024 levels, with a target of 18.0 to 20.5 MBbl per day.
This expansion is largely fueled by advanced flowback techniques in the SCOOP basin, a strategy designed to bolster profit margins and improve free cash flow. The company's second quarter 2025 performance already demonstrated this momentum, with a 26% sequential rise in liquids production, underscoring successful operational execution in this key growth area.
Operational Efficiency Leadership
Gulfport Energy demonstrates exceptional leadership in operational efficiency, particularly evident in its Ohio drilling ventures. This focus has driven significant cost savings, with drilling and completion costs per lateral foot decreasing by approximately 35% from 2022 levels, projected to reach around $900 per foot for 2025.
This robust operational performance and strict cost management create a distinct competitive edge. It allows Gulfport to sustain a strong market position and profitability, even when oil and gas prices fluctuate unpredictably.
High-Quality Inventory Expansion
Gulfport Energy is strategically investing in expanding its high-quality inventory, particularly in the Utica Shale. The company has earmarked between $75 million and $100 million for discretionary acreage acquisitions in 2025. This focused investment aims to bolster its inventory of low-breakeven wells.
This expansion is projected to add more than two years to Gulfport's existing inventory runway. Such a move is critical for sustaining its long-term production capabilities and reinforcing its leadership in key unconventional resource plays. By prioritizing organic growth of its inventory, Gulfport is positioning itself for sustained high market share in these developing plays.
- Targeted Acquisitions: $75 million to $100 million allocated for 2025 discretionary acreage acquisitions.
- Strategic Focus: Expansion of high-quality, low-breakeven inventory in the Utica Shale.
- Inventory Runway Extension: Expected to add over two years to the company's inventory life.
- Market Position: Aims to solidify long-term production and leadership in key unconventional plays.
Strategic Capital Allocation for Growth
Gulfport Energy strategically directs capital towards enhancing its development program and portfolio, aiming for greater capital efficiency and robust corporate margins.
The company prioritizes investment in its core Utica and SCOOP assets. This focus, combined with its strong adjusted free cash flow generation, solidifies these regions as key areas for sustained capital allocation to preserve and expand their market leadership.
- Strategic Capital Allocation: Gulfport's strategy centers on optimizing its development program and asset portfolio to boost capital efficiencies and corporate margins.
- Core Asset Focus: The company is heavily investing in its foundational Utica and SCOOP assets.
- Cash Flow Generation: Gulfport's ability to generate substantial adjusted free cash flow supports its ongoing investment in these key operational areas.
- Market Position: Continued investment aims to maintain and grow the leading market positions of its Utica and SCOOP assets.
Gulfport Energy's Utica Dry Gas: A Shining Star
Gulfport Energy's strategic emphasis on dry gas in the Utica region, coupled with operational efficiencies, positions this segment as a Star in its BCG Matrix. The projected 20% increase in natural gas production by the end of 2025, compared to Q1 2025, and a 28% improvement in average daily drilling footage in 2024 highlight its high growth potential.
The company's aggressive expansion into dry gas development, expected to benefit from rising natural gas prices in 2026, further solidifies its Star status. This focus on a high-growth market, supported by strong operational execution and cost management, indicates a dominant market share in this segment.
| Segment | Growth Rate | Market Share | BCG Category |
|---|---|---|---|
| Utica Dry Gas | High (Projected 20% production increase by end of 2025) | High (Strong operational efficiencies and market focus) | Star |
| SCOOP Liquids | High (Projected 30% liquids production increase by 2025) | Moderate to High (Driven by advanced flowback techniques) | Question Mark / Star |
What is included in the product
Detailed Word Document
This BCG Matrix overview for Gulfport Energy analyzes its business units based on market share and growth.
It provides strategic guidance on which segments to invest in, maintain, or divest.
Customizable Excel Spreadsheet
A clear BCG Matrix visualizes Gulfport Energy's portfolio, alleviating the pain of complex strategic decision-making.
Cash Cows
Utica and Marcellus Natural Gas Production
Gulfport Energy's Utica and Marcellus natural gas production in Eastern Ohio are its undisputed cash cows. These regions are the backbone of the company's operations, contributing around 80% of its total output in 2024, primarily in the form of natural gas.
Despite potential fluctuations in the broader natural gas market, Gulfport's well-established presence in these mature basins ensures a steady and significant generation of cash flow. This consistent performance underscores their role as reliable profit drivers for the company.
SCOOP Natural Gas and Liquids Production (Mature)
Gulfport Energy's SCOOP Natural Gas and Liquids Production (Mature) segment, primarily in Oklahoma's Woodford and Springer plays, functions as a classic cash cow. These operations are the bedrock of its revenue, consistently generating reliable income.
While not as expansive as its Utica operations, the SCOOP assets are mature, meaning they leverage established infrastructure for cost-effective production. This efficiency translates into strong, consistent cash flow for Gulfport.
In 2024, Gulfport reported that its SCOOP assets continued to provide a significant and stable contribution to its overall production volumes, underpinning its financial stability. The focus here is on maximizing returns from existing, low-cost wells rather than aggressive expansion.
Consistent Free Cash Flow Generation
Gulfport Energy's core assets are performing exceptionally well, consistently producing substantial free cash flow. The company anticipates generating between $2.8 billion and $3.6 billion in adjusted free cash flow from 2025 through 2029, depending on commodity prices. This strong cash generation is a hallmark of mature, profitable operations.
Historically, Gulfport has returned a significant portion of this cash flow to shareholders, with 96-99% directed towards share repurchases. These established production streams are the engine driving shareholder returns and supporting broader corporate objectives.
Low Leverage and Strong Liquidity
Gulfport Energy demonstrates a robust financial footing, characterized by a prudent leverage ratio of roughly 0.85x. This conservative approach to debt management is further supported by significant liquidity, which stood at approximately $885 million as of the second quarter of 2025. This financial health is a direct result of its cash-generating assets, allowing for effective debt servicing and strategic capital deployment without undue reliance on external funding for day-to-day activities.
This financial stability is a hallmark of successful cash cow operations.
- Conservative Leverage: Gulfport Energy maintains a low debt-to-equity ratio, around 0.85x, indicating a strong capacity to meet its financial obligations.
- Substantial Liquidity: With approximately $885 million in liquidity as of Q2 2025, the company possesses ample resources to manage operations and pursue opportunities.
- Financial Flexibility: The combination of low leverage and high liquidity provides Gulfport with considerable freedom in allocating capital and weathering market fluctuations.
Optimized Per-Unit Operating Costs
Gulfport Energy's optimized per-unit operating costs are a key driver of its cash cow status. In the second quarter of 2025, the company reported per-unit operating costs of $1.22 per Mcfe. This figure reflects a sustained effort in cost discipline, showing improvements from previous periods.
These highly efficient operating costs, particularly within its core production regions, translate directly into robust profit margins for its mature assets. This efficiency solidifies these assets’ position as reliable cash generators for the company.
- Disciplined Operating Costs: Per-unit operating costs at $1.22 per Mcfe in Q2 2025.
- High Profit Margins: Low costs ensure strong profitability from mature assets.
- Cash Flow Maximization: Operational efficiency directly boosts cash flow from existing production.
Gulfport's Cash Cows: Utica, Marcellus, and SCOOP Fueling Growth
Gulfport Energy's Utica and Marcellus natural gas production in Eastern Ohio, along with its SCOOP Natural Gas and Liquids Production in Oklahoma, are firmly established as its cash cows. These regions consistently generate substantial free cash flow, a testament to their mature and efficient operations. The company anticipates generating between $2.8 billion and $3.6 billion in adjusted free cash flow from 2025 through 2029, with a significant portion attributed to these core assets.
These cash cows are characterized by disciplined operating costs, with per-unit costs at $1.22 per Mcfe in Q2 2025, ensuring strong profit margins. This operational efficiency directly translates into robust cash generation, allowing Gulfport to maintain a conservative leverage ratio of approximately 0.85x and substantial liquidity of $885 million as of Q2 2025.
The company prioritizes returning this generated cash to shareholders, with 96-99% historically directed towards share repurchases, underscoring the reliable profitability of these mature production areas.
| Asset Segment | Primary Region | 2024 Production Contribution (Approx.) | Key Characteristic |
|---|---|---|---|
| Utica & Marcellus | Eastern Ohio | ~80% of Total Output | Mature, High-Volume Natural Gas Production |
| SCOOP Natural Gas and Liquids | Oklahoma (Woodford & Springer) | Significant & Stable Contribution | Mature, Cost-Effective Production |
| Financial Metric | |||
| Adjusted Free Cash Flow (2025-2029 Est.) | $2.8B - $3.6B | Driven by Cash Cow Assets | |
| Leverage Ratio (Approx.) | 0.85x | Conservative Debt Management | |
| Liquidity (Q2 2025) | $885 Million | Strong Financial Flexibility |
Preview = Final Product
Gulfport Energy BCG Matrix
The Gulfport Energy BCG Matrix preview you are viewing is the exact, fully formatted document you will receive immediately after purchase. This means no watermarks, no demo content, and no surprises—just a professionally designed, analysis-ready report ready for your strategic planning and decision-making.
Original: $10.00
-65%$10.00
$3.50Product Information
Product Information
Shipping & Returns
Shipping & Returns
Description
Unlock Strategic Clarity
Curious about Gulfport Energy's strategic positioning? Our BCG Matrix preview hints at which segments are driving growth and which might need a closer look. Don't miss out on the full picture—unlock the complete BCG Matrix to understand their Stars, Cash Cows, Dogs, and Question Marks, and gain actionable insights for your own strategic planning.
Stars
Utica Dry Gas Development
Gulfport Energy is making a significant strategic move towards dry gas development in the Utica region. This focus is projected to drive a substantial 20% increase in their natural gas production by the end of 2025, when compared to the first quarter of that year.
This strategic pivot is well-timed, aligning with a positive outlook for the natural gas market in 2026. The company anticipates benefiting from rising commodity prices, making this a key growth area.
Operational enhancements in Ohio are fueling this expansion, evidenced by a notable 28% improvement in average daily drilling footage throughout 2024. This efficiency boost solidifies the Utica dry gas play as a high-growth, high-market-share segment for Gulfport Energy.
Liquids Production Growth
Gulfport Energy is projecting a significant increase in its net daily liquids production, aiming for a 30% jump by 2025 over 2024 levels, with a target of 18.0 to 20.5 MBbl per day.
This expansion is largely fueled by advanced flowback techniques in the SCOOP basin, a strategy designed to bolster profit margins and improve free cash flow. The company's second quarter 2025 performance already demonstrated this momentum, with a 26% sequential rise in liquids production, underscoring successful operational execution in this key growth area.
Operational Efficiency Leadership
Gulfport Energy demonstrates exceptional leadership in operational efficiency, particularly evident in its Ohio drilling ventures. This focus has driven significant cost savings, with drilling and completion costs per lateral foot decreasing by approximately 35% from 2022 levels, projected to reach around $900 per foot for 2025.
This robust operational performance and strict cost management create a distinct competitive edge. It allows Gulfport to sustain a strong market position and profitability, even when oil and gas prices fluctuate unpredictably.
High-Quality Inventory Expansion
Gulfport Energy is strategically investing in expanding its high-quality inventory, particularly in the Utica Shale. The company has earmarked between $75 million and $100 million for discretionary acreage acquisitions in 2025. This focused investment aims to bolster its inventory of low-breakeven wells.
This expansion is projected to add more than two years to Gulfport's existing inventory runway. Such a move is critical for sustaining its long-term production capabilities and reinforcing its leadership in key unconventional resource plays. By prioritizing organic growth of its inventory, Gulfport is positioning itself for sustained high market share in these developing plays.
- Targeted Acquisitions: $75 million to $100 million allocated for 2025 discretionary acreage acquisitions.
- Strategic Focus: Expansion of high-quality, low-breakeven inventory in the Utica Shale.
- Inventory Runway Extension: Expected to add over two years to the company's inventory life.
- Market Position: Aims to solidify long-term production and leadership in key unconventional plays.
Strategic Capital Allocation for Growth
Gulfport Energy strategically directs capital towards enhancing its development program and portfolio, aiming for greater capital efficiency and robust corporate margins.
The company prioritizes investment in its core Utica and SCOOP assets. This focus, combined with its strong adjusted free cash flow generation, solidifies these regions as key areas for sustained capital allocation to preserve and expand their market leadership.
- Strategic Capital Allocation: Gulfport's strategy centers on optimizing its development program and asset portfolio to boost capital efficiencies and corporate margins.
- Core Asset Focus: The company is heavily investing in its foundational Utica and SCOOP assets.
- Cash Flow Generation: Gulfport's ability to generate substantial adjusted free cash flow supports its ongoing investment in these key operational areas.
- Market Position: Continued investment aims to maintain and grow the leading market positions of its Utica and SCOOP assets.
Gulfport Energy's Utica Dry Gas: A Shining Star
Gulfport Energy's strategic emphasis on dry gas in the Utica region, coupled with operational efficiencies, positions this segment as a Star in its BCG Matrix. The projected 20% increase in natural gas production by the end of 2025, compared to Q1 2025, and a 28% improvement in average daily drilling footage in 2024 highlight its high growth potential.
The company's aggressive expansion into dry gas development, expected to benefit from rising natural gas prices in 2026, further solidifies its Star status. This focus on a high-growth market, supported by strong operational execution and cost management, indicates a dominant market share in this segment.
| Segment | Growth Rate | Market Share | BCG Category |
|---|---|---|---|
| Utica Dry Gas | High (Projected 20% production increase by end of 2025) | High (Strong operational efficiencies and market focus) | Star |
| SCOOP Liquids | High (Projected 30% liquids production increase by 2025) | Moderate to High (Driven by advanced flowback techniques) | Question Mark / Star |
What is included in the product
Detailed Word Document
This BCG Matrix overview for Gulfport Energy analyzes its business units based on market share and growth.
It provides strategic guidance on which segments to invest in, maintain, or divest.
Customizable Excel Spreadsheet
A clear BCG Matrix visualizes Gulfport Energy's portfolio, alleviating the pain of complex strategic decision-making.
Cash Cows
Utica and Marcellus Natural Gas Production
Gulfport Energy's Utica and Marcellus natural gas production in Eastern Ohio are its undisputed cash cows. These regions are the backbone of the company's operations, contributing around 80% of its total output in 2024, primarily in the form of natural gas.
Despite potential fluctuations in the broader natural gas market, Gulfport's well-established presence in these mature basins ensures a steady and significant generation of cash flow. This consistent performance underscores their role as reliable profit drivers for the company.
SCOOP Natural Gas and Liquids Production (Mature)
Gulfport Energy's SCOOP Natural Gas and Liquids Production (Mature) segment, primarily in Oklahoma's Woodford and Springer plays, functions as a classic cash cow. These operations are the bedrock of its revenue, consistently generating reliable income.
While not as expansive as its Utica operations, the SCOOP assets are mature, meaning they leverage established infrastructure for cost-effective production. This efficiency translates into strong, consistent cash flow for Gulfport.
In 2024, Gulfport reported that its SCOOP assets continued to provide a significant and stable contribution to its overall production volumes, underpinning its financial stability. The focus here is on maximizing returns from existing, low-cost wells rather than aggressive expansion.
Consistent Free Cash Flow Generation
Gulfport Energy's core assets are performing exceptionally well, consistently producing substantial free cash flow. The company anticipates generating between $2.8 billion and $3.6 billion in adjusted free cash flow from 2025 through 2029, depending on commodity prices. This strong cash generation is a hallmark of mature, profitable operations.
Historically, Gulfport has returned a significant portion of this cash flow to shareholders, with 96-99% directed towards share repurchases. These established production streams are the engine driving shareholder returns and supporting broader corporate objectives.
Low Leverage and Strong Liquidity
Gulfport Energy demonstrates a robust financial footing, characterized by a prudent leverage ratio of roughly 0.85x. This conservative approach to debt management is further supported by significant liquidity, which stood at approximately $885 million as of the second quarter of 2025. This financial health is a direct result of its cash-generating assets, allowing for effective debt servicing and strategic capital deployment without undue reliance on external funding for day-to-day activities.
This financial stability is a hallmark of successful cash cow operations.
- Conservative Leverage: Gulfport Energy maintains a low debt-to-equity ratio, around 0.85x, indicating a strong capacity to meet its financial obligations.
- Substantial Liquidity: With approximately $885 million in liquidity as of Q2 2025, the company possesses ample resources to manage operations and pursue opportunities.
- Financial Flexibility: The combination of low leverage and high liquidity provides Gulfport with considerable freedom in allocating capital and weathering market fluctuations.
Optimized Per-Unit Operating Costs
Gulfport Energy's optimized per-unit operating costs are a key driver of its cash cow status. In the second quarter of 2025, the company reported per-unit operating costs of $1.22 per Mcfe. This figure reflects a sustained effort in cost discipline, showing improvements from previous periods.
These highly efficient operating costs, particularly within its core production regions, translate directly into robust profit margins for its mature assets. This efficiency solidifies these assets’ position as reliable cash generators for the company.
- Disciplined Operating Costs: Per-unit operating costs at $1.22 per Mcfe in Q2 2025.
- High Profit Margins: Low costs ensure strong profitability from mature assets.
- Cash Flow Maximization: Operational efficiency directly boosts cash flow from existing production.
Gulfport's Cash Cows: Utica, Marcellus, and SCOOP Fueling Growth
Gulfport Energy's Utica and Marcellus natural gas production in Eastern Ohio, along with its SCOOP Natural Gas and Liquids Production in Oklahoma, are firmly established as its cash cows. These regions consistently generate substantial free cash flow, a testament to their mature and efficient operations. The company anticipates generating between $2.8 billion and $3.6 billion in adjusted free cash flow from 2025 through 2029, with a significant portion attributed to these core assets.
These cash cows are characterized by disciplined operating costs, with per-unit costs at $1.22 per Mcfe in Q2 2025, ensuring strong profit margins. This operational efficiency directly translates into robust cash generation, allowing Gulfport to maintain a conservative leverage ratio of approximately 0.85x and substantial liquidity of $885 million as of Q2 2025.
The company prioritizes returning this generated cash to shareholders, with 96-99% historically directed towards share repurchases, underscoring the reliable profitability of these mature production areas.
| Asset Segment | Primary Region | 2024 Production Contribution (Approx.) | Key Characteristic |
|---|---|---|---|
| Utica & Marcellus | Eastern Ohio | ~80% of Total Output | Mature, High-Volume Natural Gas Production |
| SCOOP Natural Gas and Liquids | Oklahoma (Woodford & Springer) | Significant & Stable Contribution | Mature, Cost-Effective Production |
| Financial Metric | |||
| Adjusted Free Cash Flow (2025-2029 Est.) | $2.8B - $3.6B | Driven by Cash Cow Assets | |
| Leverage Ratio (Approx.) | 0.85x | Conservative Debt Management | |
| Liquidity (Q2 2025) | $885 Million | Strong Financial Flexibility |
Preview = Final Product
Gulfport Energy BCG Matrix
The Gulfport Energy BCG Matrix preview you are viewing is the exact, fully formatted document you will receive immediately after purchase. This means no watermarks, no demo content, and no surprises—just a professionally designed, analysis-ready report ready for your strategic planning and decision-making.